












Contents
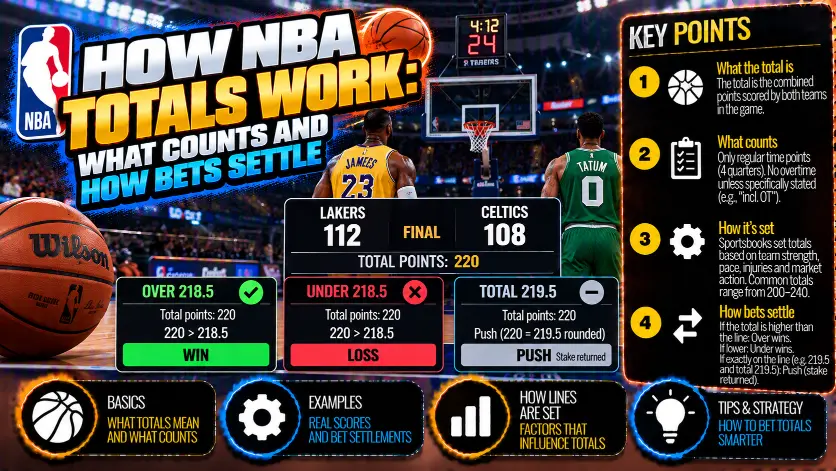
An NBA total is a bet on the combined points of both teams against a posted line, such as 220.5. By ToolsGambling's calculation, a -110 price breaks even at a 52.38% win probability. By ToolsGambling's calculation with a regulation-time average total of 220 and a standard deviation of 16 (how widely totals are assumed to vary), Over 220.5 gives 48.75% with no overtime, 50.01% at a 3% overtime probability and 51.26% at 6%, all below the 52.38% break-even at -110. The break-even threshold depends on the price, not on these scoring assumptions.
Key takeaways
- A game total generally includes both teams’ points in regulation time and overtime; a regulation-only market excludes overtime.
- A quarter total counts only the points scored by both teams in the selected quarter.
- At -110, the break-even probability is 52.38%. Changing the price changes that threshold.
- A 220.5 line cannot produce an exact tie, so there is no refund for the score landing exactly on that line.
What is a total, and how do you read a 220.5 line?
A total over/under compares the combined points scored during the selected period with a posted line, rather than predicting the winner.
For Over 220.5, the combined score must finish above 220.5. For Under 220.5, the combined score must finish below it. Which team wins does not determine the result of the total.
A team total counts only one team’s points. A point spread concerns the scoring margin between the teams. Read the market name before using a scoring estimate: those bets measure different things.
What does the .5 mean?
The .5 prevents the final point total from matching the line exactly because basketball scores are whole numbers.
A whole-number line can produce a refund on an exact tie when the market’s settlement rules provide for one. A refund returns the stake without a profit; a winning payout includes both the returned stake and the profit.
What does the game total include: regulation time and overtime?
A game total that includes overtime counts both teams’ points throughout regulation time and every overtime period; a regulation-only total stops at the end of regulation time.
NBA regulation time consists of four 12-minute periods, and each overtime period lasts 5 minutes. The official NBA rules, Rule 5, Section II, items 1–2 state: “All periods of regulation play in the NBA will be twelve minutes.” and “All overtime periods of play will be five minutes.”
Betstamp describes the usual game-total treatment as follows: “Totals wagers, commonly known as over/under bets, include all points scored during overtime.”
How many points does overtime add in the calculation?
ToolsGambling’s expected scoring for one overtime period is 22.92 points, assuming an average total of 220 over 48 minutes.
That estimate extends the assumed regulation scoring rate to an overtime period. The calculation also assumes an overtime standard deviation of 6. The expected value is not a fixed addition to every game: if no overtime is played, no overtime points are added.
The overtime probabilities of 3% and 6% used below are calculation parameters, not measured NBA overtime frequencies.
Diagram: which periods count toward an NBA game total and a quarter totalEducational diagram by ToolsGambling: a game total includes overtime, a quarter total covers only the stated quarter. 29.10.2026.
How do quarter totals use their own line and calculation?
A quarter total counts both teams’ points only in the named quarter, with no points carried over from other quarters or overtime.
According to Betzona’s rules, quarter and half totals cover only the selected period of the game. Betstamp also places quarter totals within regulation time: “The same principle applies to quarter-by-quarter totals and some player props tied exclusively to regulation.”
A quarter estimate therefore needs its own scoring assumptions. An expected game total does not automatically establish the expected score for a particular quarter.
What does the Over 58.5 example show?
With a mean of 57 and a standard deviation of 8, Over 58.5 has a 42.56% chance; raising the mean by one point adds 4.94 percentage points.
At -110, the base case has expected net profit of -18.74 per 100 staked. With a mean of 58 and the same standard deviation of 8, the probability is 47.51%, and expected net profit is -9.30 per 100 staked.
A mean of about 59.0, with a standard deviation of 8, brings the calculation to the break-even boundary at -110. Reaching that boundary is not the same as establishing an advantage.
These are conditional calculations, not forecasts for an identified game. Probabilities, changes and expected-profit figures are rounded; the displayed change need not equal the difference between the rounded endpoints.
Why can’t you add quarter lines to get the game line?
Quarter lines are separate betting offers, not components that must add up to the game line.
Each quarter market has its own line and price. The game total can also include overtime, which does not become part of any regulation quarter. Adding the quarter lines does not resolve that difference in time scope.
Why is break-even at -110 equal to 52.38%?
At a -110 price, the selected outcome needs a 52.38% win probability to break even; the controlling assumption is the price itself.
A different price changes the required probability. The calculation does not cover an alternative price, so no numerical sensitivity to a price change is available. The probability calculator continues the price-to-probability comparison.
The -110 figure is a betting price, not a negative payout or a predicted point spread. See how betting odds work for the distinction between price and probability.
Both sides of a line carry the margin, so the offered prices should not be treated as objective probabilities. The margin calculator addresses that pricing component.
The break-even probability comes from the price. A scoring estimate supplies a separate probability for the outcome. Comparing those two quantities is what tests the bet’s expected value.
What changes the conclusion: overtime probability or the quarter mean?
Overtime probability changes the game-total estimate, while the assumed quarter mean changes the quarter-total estimate.
The game calculation assumes a regulation time mean of 220, a standard deviation of 16 and an overtime standard deviation of 6. The quarter calculation uses a standard deviation of 8. These are calculation assumptions, not established league statistics. The standard deviation measures how widely scoring outcomes are assumed to vary around the mean. Both probabilities assume a normal distribution. The regulation mean of 220 sits just below the 220.5 line, which is why the regulation-only probability is below 50%.
| Market and scenario | Probability of Over | Main assumption or sensitivity |
|---|---|---|
| Game total 220.5, no overtime played | 48.75% | Base case, conditional on no overtime |
| Game total 220.5, overtime probability 3% | 50.01% | Overtime probability adds 1.25 percentage points to the base case |
| Game total 220.5, overtime probability 6% | 51.26% | Overtime probability adds 2.51 percentage points to the base case |
| Quarter total 58.5, mean 57 | 42.56% | Raising the mean by one point adds 4.94 percentage points |
| Quarter total 58.5, mean 58 | 47.51% | Standard deviation remains 8 |
| Quarter total 58.5, mean about 59.0 | About the 52.38% break-even threshold | Standard deviation 8 and price -110 |
ToolsGambling calculation summary, 29.10.2026. Results are conditional on these assumptions. Figures are rounded.
Under these assumptions, allowing for overtime raises the probability of Over 220.5 but does not bring it to break-even at -110.
An estimated probability below 52.38% makes Over negative in expected value at -110; the value bet calculator continues that comparison. A negative expectation for Over does not, by itself, establish value on Under without considering Under’s price.
How do you check market rules before betting?
Before confirming a bet, read the full market name, identify the period covered and check the overtime wording.
The sportsbook’s own market rules determine settlement; check them directly rather than applying one operator’s wording to every sportsbook.
Use this reading sequence:
- Identify what counts. Distinguish a game total, quarter total and team total.
- Identify the time scope. Separate regulation time from a game total that includes overtime.
- Read the line and direction. Confirm whether the selection is Over or Under.
- Read the price. Compare the estimated probability with the break-even requirement for that price.
No calculator is needed to identify the market. A probability calculation becomes useful only after those conditions are clear.
What are the calculation’s limits and the common mistakes?
The calculation tests scoring assumptions against a price; it does not establish a future score or guarantee a betting result.
Choosing a quarter total simply because its line is smaller does not make the prediction easier. Use the period whose scoring you can justify estimating. If the assumptions lack a sound basis, neither market needs to be selected.
Changing the quarter mean merely to make a bet appear attractive reverses the purpose of the calculation. The mean should represent an independent scoring estimate, not a target chosen to reach break-even.
Expected net profit describes repeated outcomes under the assumptions, not the result of a single bet. A negative-expectation bet can win, and a break-even calculation does not promise a refund on an individual wager.
How the calculation handles a single overtime
The overtime calculation allows at most a single extra period. If regulation ends level, that period can add points to the full-game total. Repeat overtimes are not included. This is a limit of the calculation, not a claim that a real NBA game must finish after its initial overtime. A game that remains tied can continue, so the calculation does not describe every possible path to a final score.
Overtime is possible only after a regulation tie. It should not be understood as extra scoring that can be attached to any regulation result. The overtime probability represents the chance of reaching that tied state. The additional scoring then affects the total only on that branch of the calculation. This distinction matters when interpreting the overall probability: the overtime scoring assumption does not apply to every game.
Within that branch, overtime points are treated as independent of the regulation total. The calculation uses an overtime scoring mean of 22.92 and a standard deviation of 6, without adjusting those points according to how high or low regulation scoring was. Independence here concerns the amount scored in overtime, not whether overtime can occur. A regulation tie remains the condition for reaching it.
That simplification leaves out possible connections between regulation and extra-period scoring, such as fatigue or a shared pace. It makes the assumptions easier to inspect, but it also limits what the result can tell you about games with unusual scoring conditions.
Reading the sensitivity table
Read each row as a conditional answer: if these assumptions hold, this is the resulting probability. Start by identifying what changes between the rows you want to compare. A change in overtime probability answers a different question from a change in average scoring. Comparing rows with several different assumptions can show an overall difference, but it does not isolate the effect of any particular assumption.
The full-game probabilities of 48.75%, 50.01% and 51.26% show how the estimate responds to the overtime scenarios. Read them alongside the 52.38% break-even threshold rather than treating an increase as evidence that a bet is worthwhile. A scenario can improve relative to the base case while remaining below the probability required by the price.
The quarter probabilities of 42.56% and 47.51% belong to a separate comparison. They should not be combined with the full-game probabilities or interpreted as pieces that add up to the match estimate. Each row concerns its own scoring period and assumptions. The quarter standard deviation of 8 also describes a different distribution from the full-game standard deviation of 16.
Figures are rounded for readability. Changes are calculated before rounding, so subtracting the displayed endpoints may not reproduce the displayed change exactly. Use the reported change when discussing sensitivity, and avoid treating a small rounding discrepancy as a separate finding. More importantly, the precision of the display does not establish that the underlying assumptions are equally precise.
What the calculation does not include
The calculation starts with scoring assumptions rather than building them from team news. It does not independently evaluate starting lineups, injuries, minutes restrictions or the likely distribution of playing time. If a player’s availability changes, the result does not automatically update. You would need a defensible reason to revise the relevant scoring assumptions before interpreting the probability for that matchup.
Pace and rest are also outside the calculation as separate factors. A faster expected game may affect average scoring, while uncertainty about rotations may affect how widely outcomes vary. Those effects are not interchangeable. Raising the mean and increasing the standard deviation can produce different changes in the chance of clearing a line, so a general impression that a game will be unpredictable is not enough to choose an adjustment.
The probabilities assume a normal distribution for scoring. This is a mathematical approximation, not a description of every feature of basketball scores. Actual totals are discrete, and game events can create patterns that a smooth distribution does not capture. The approximation is useful for examining how assumptions affect probabilities, but it should not be mistaken for evidence that those assumptions fit a particular team or period.
Nor does this exercise test how well the assumptions predict future games. That would require comparing estimates with relevant results and checking whether the method remains useful outside the examples used to develop it. A clear calculation can still rest on weak assumptions. Understanding the arithmetic and validating the assumptions are separate tasks.
Checking your own estimate before using the table
Where does your mean come from? Be able to explain why you expect that level of scoring in this quarter. A recent high-scoring game is not enough on its own. Check whether your estimate reflects the likely pace, available players and rotations rather than a result you hope to see. Treat 57 and 58 as assumptions to justify, not interchangeable choices.
Does your standard deviation match the typical scoring variation for this kind of quarter? Using 8 simply because it appears in the example does not establish that it fits your estimate. Compare quarters with similar conditions, and distinguish variation in scoring from uncertainty about the mean itself. The table cannot resolve that distinction for you.
What changes if your mean is one point too high? Read the result for the lower mean before deciding whether the price looks attractive. Compare both estimates with the 52.38% break-even threshold. If your conclusion depends on the higher mean, you need stronger support for that assumption, not just confidence in the arithmetic.
Who should use a total and who should not
Totals analysis suits someone who wants to study combined scoring rather than choose a winner, and who is willing to distinguish a scoring opinion from a probability estimate. It can also help a reader compare the consequences of different assumptions without pretending to know the exact final score. The useful habit is to ask what would need to be true for an estimate to apply.
It is less suitable for someone seeking a guaranteed result, a quick recovery from losses or confirmation of a preferred bet. If you cannot explain why the scoring assumptions fit the game, the table is better used as an educational example than as a reason to stake money. Declining to bet is a valid outcome of the analysis.
Even a well-supported estimate does not remove uncertainty or make a loss affordable. Keep the decision about whether to gamble separate from the mathematical comparison. Anyone who finds that betting creates financial pressure or is difficult to control should step away rather than use increasingly detailed calculations to justify continuing.
Compare quarter totals across different means
For a quarter total of 58.5 with a standard deviation of 8, compare the estimates as a progression rather than treating each as a separate betting signal:
| Quarter mean | Probability of Over 58.5 | Expected profit per 100 staked at -110 |
|---|---|---|
| 57 | 42.56% | -18.74 |
| 58 | 47.51% | -9.30 |
| About 59.0 | About 52.38%, the break-even threshold | About break-even |
The move from a mean of 57 to 58 improves the result, but it does not make the bet profitable at that price. The useful question is whether you can justify a mean near the break-even level while keeping the same standard deviation. Choosing a higher mean just to clear the threshold reverses the purpose of the calculation.
Choose the market that matches your estimate
Use a quarter market when your estimate concerns that quarter. Use a full-game market when your estimate concerns the whole game and you can account for the market’s overtime rules. A full-game mean does not tell you how scoring is distributed across individual quarters.
Overtime also makes the choice consequential. In the full-game example, a 3% overtime probability changes the Over probability by 1.25 percentage points. That adjustment belongs to the full-game calculation, not to a quarter total. Choose the scoring period first, then assess its price.
A three-step check before using the result
- Match the scope. Check that your scoring estimate and the market cover the same period, including the treatment of overtime.
- Test the assumptions. Change the mean while holding the standard deviation fixed, as in the quarter comparison, to see whether your conclusion depends on a narrow estimate.
- Compare with the price. Judge the probability against the break-even threshold, not just against the probability in a less favourable scenario. A smaller expected loss is still a loss.
How should you put NBA totals into practice?
Compare both teams’ points over the selected period with the line, then compare your estimated outcome probability with the price’s break-even requirement.
By ToolsGambling's calculation under these assumptions, a regulation time mean of 220, a standard deviation of 16 and an overtime standard deviation of 6, none of the Over 220.5 scenarios reaches break-even at -110. Moving overtime probability from the no-overtime base case to 3% adds 1.25 percentage points; moving it to 6% adds 2.51 percentage points.
For Over 58.5 in a quarter, the break-even mean is about 59.0 at a standard deviation of 8. The practical sequence is to define the period, justify the scoring assumptions and only then assess the price.
For the adjacent topic, see the NBA betting system guide.
Frequently Asked Questions
Add both teams’ points over the period specified by the market. For a game total including overtime, use the final combined score after overtime.
Overtime generally counts toward a game total, but not toward an individual quarter total. The selected market’s time scope distinguishes an overtime-inclusive total from a regulation-only total.
The combined score must finish above 220.5 during the period covered by the bet. Whole-number scoring makes an exact tie with that line impossible.
Only both teams’ points in the selected quarter count. Over wins above 58.5; points from other quarters are excluded.
The break-even probability is 52.38%, determined by the -110 price. That threshold is not an estimate of how likely a particular NBA total is to win.
No. Quarter lines are separate offers, and the game total may include overtime that the quarter totals exclude.
Evgeniy Volkov
Verified ExpertFullstack developer with a background in mathematics. I build the calculators and game-style tools on ToolsGambling with Pixi.js and modern web tech, and every result uses transparent probability formulas you can verify yourself.